Most people measure their fitness levels by what the scales say. But weight alone tells you very little about where your fitness actually stands. Two people can weigh exactly the same and have completely different health profiles depending on where that weight is sitting and how much of it is fat versus muscle.
Waist to height ratio is one of the most straightforward and reliable tools for measuring your fitness levels, and it is a far better indicator than BMI (Body Mass Index). Unlike BMI, which only compares your total weight against your height, waist to height ratio looks specifically at where fat is being stored.
Why Waist To Height Ratio Is More Useful Than BMI
BMI has been the standard health screening tool for decades, but it has limitations. Because it only accounts for total body weight divided by height squared, it does not distinguish between muscle and fat. A highly muscular person can register as overweight on a BMI scale despite having very low body fat, while someone with low total body weight can have a dangerous level of visceral fat that BMI completely misses.
Waist to height ratio addresses this directly. By measuring where fat is distributed relative to your height, it captures the risk associated with abdominal fat storage that BMI cannot detect. Multiple studies have shown it to be a superior predictor of cardiovascular disease, type 2 diabetes and early mortality compared to BMI.
Why Visceral Fat Matters More Than Total Weight
Visceral fat, the fat that accumulates around the organs in the abdominal area, behaves differently to fat stored under the skin. It is metabolically active, meaning it releases inflammatory signals and hormones that interfere with how your body processes blood sugar and regulates cholesterol. This is why central obesity is one of the five criteria used to diagnose metabolic syndrome, a cluster of conditions that significantly raises your risk of cardiovascular disease, type 2 diabetes and stroke.
Research from the TILDA study at Trinity College Dublin found that 40% of Irish adults over 50 meet the criteria for metabolic syndrome, and a high waist circumference is one of the most common contributing factors.
How To Measure Your Waist Correctly
Before using the charts below, it is worth knowing how to take an accurate measurement. Stand up straight and breathe out normally. Measure around your bare abdomen at the midpoint between the bottom of your rib cage and the top of your hip bone. For most people this is roughly at or just above the belly button.
Keep the tape snug but not tight, and make sure it is level all the way around. Take the reading after a normal exhale, not while holding your breath in. It is easy to get slightly different numbers depending on technique, so taking the measurement two or three times and using the average gives you the most reliable result.
How To Calculate Your Ratio
Divide your waist measurement by your height. Use the same unit for both, either centimetres or inches. For example, if your waist is 80cm and your height is 170cm, your ratio is 80 divided by 170 which equals 0.47. This falls in the healthy range.
The general guidance is:
- Below 0.40: Possible underweight
- 0.40 to 0.49: Healthy range
- 0.50 to 0.59: Increased risk, worth taking action
- 0.60 and above: High risk, medical review recommended
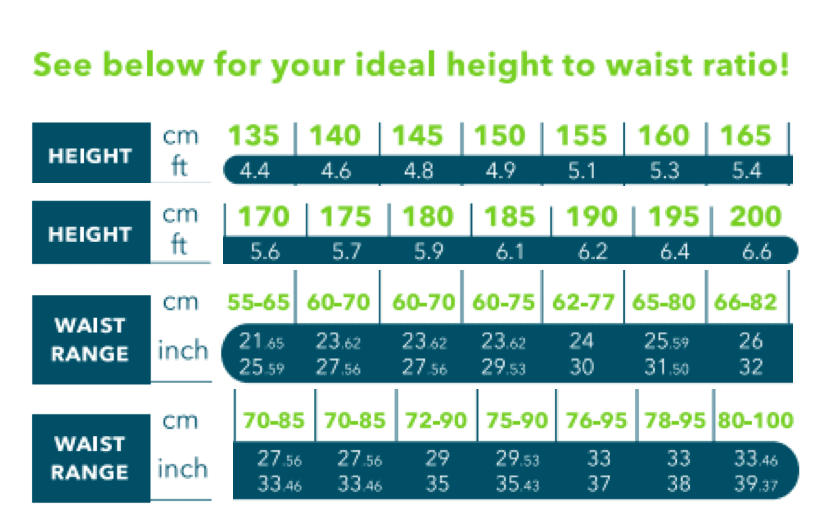
The chart below maps this visually across a range of heights and waist measurements. Use your height on the left axis and your waist measurement along the bottom to find your colour zone.
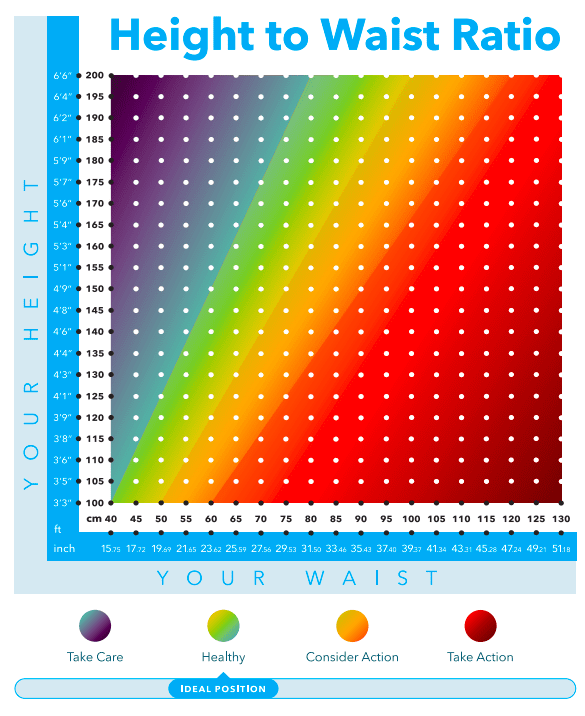
Green means you are in a healthy range. Yellow and orange signal that it is worth paying attention and making some changes. Red indicates a higher level of risk and suggests that taking action now, rather than waiting, is the smarter move.
It is important to understand that waist to height ratio is not a diagnosis. It is a screening tool that gives you a useful early warning signal about your risk.
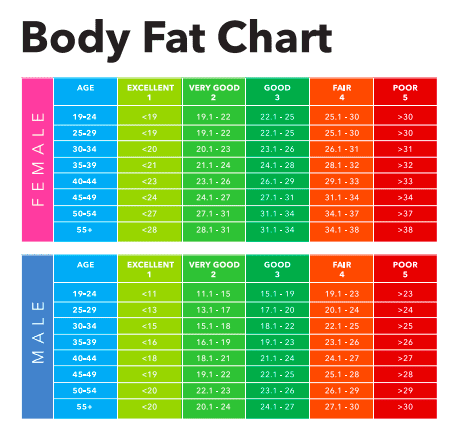
Body Fat Percentage By Age And Gender
Waist to height ratio gives you a quick snapshot of central fat distribution, but understanding your overall body fat percentage adds another layer of useful information. The chart below shows healthy body fat ranges broken down by age group for both men and women.
Body fat percentage is not something you can calculate from a standard scale. A proper body composition analysis, such as an InBody scan, gives you an accurate reading of fat mass versus lean muscle mass. This matters because two people who weigh the same can have dramatically different body fat percentages depending on how much muscle they carry.
Muscle is denser and more compact than fat, which is why someone who trains regularly can look lean and feel fit while weighing more than someone who is sedentary. The number on the scales does not tell you this story. Body composition does.
If you are in the green zone, you are in a healthy range. That does not mean there is nothing to work on, but it does mean the foundations are solid. Keep doing what you are doing and continue monitoring every few months.
If you are in the orange or red zone, the most effective thing you can do is start building lean muscle mass through resistance training and support that with a low glycaemic approach to nutrition.
These two things work together directly on the problem. Resistance training increases the amount of metabolically active muscle tissue in your body, which boosts your resting metabolism and improves how your body uses glucose and stores fat. Low glycaemic eating keeps blood sugar stable throughout the day, which reduces the hormonal signals that drive abdominal fat storage.
What To Do Next
If your numbers are in the yellow, orange or red zone, or if you want to understand more about your body composition beyond this chart, a free consultation at Educogym gives you exactly that starting point. Our body composition assessment uses InBody technology to give you a detailed breakdown of your muscle mass, body fat and visceral fat levels, alongside a personalised programme built around improving those numbers.
With gyms in Blackrock, Castleknock, Dundrum, Dublin Docklands, Naas, North Wicklow and more locations throughout Ireland, our system is built to give you clarity, coaching, and real accountability to act on your numbers. Book a free consultation and take the first step toward actual, measurable change.
References:
- Kim MS, Jung TK, Kim TY. Comparative Study of Body Mass Index and Waist to Height Ratio of Korean Adults by Occupations. Iran J Public Health. 2017 Oct;46(10):1440-1442. PMID: 29308391; PMCID: PMC5750359.
- Body Mass Index Obesity, BMI, and Health – A Critical Review. Nuttall, Frank Q. MD, PhD. Nutrition Today: May/June 2015 – Volume 50 – Issue 3 – p 117–128. doi: 10.1097/NT.0000000000000092Nutrition Research
- A systematic review of waist-to-height ratio as a screening tool for the prediction of cardiovascular disease and diabetes: 0·5 could be a suitable global boundary value. Browning LM, Hsieh SD, Ashwell M. Nutr Res Rev. 2010 Dec;23(2):247-69. doi: 10.1017/S0954422410000144. Epub 2010 Sep 7.